The Loch Database
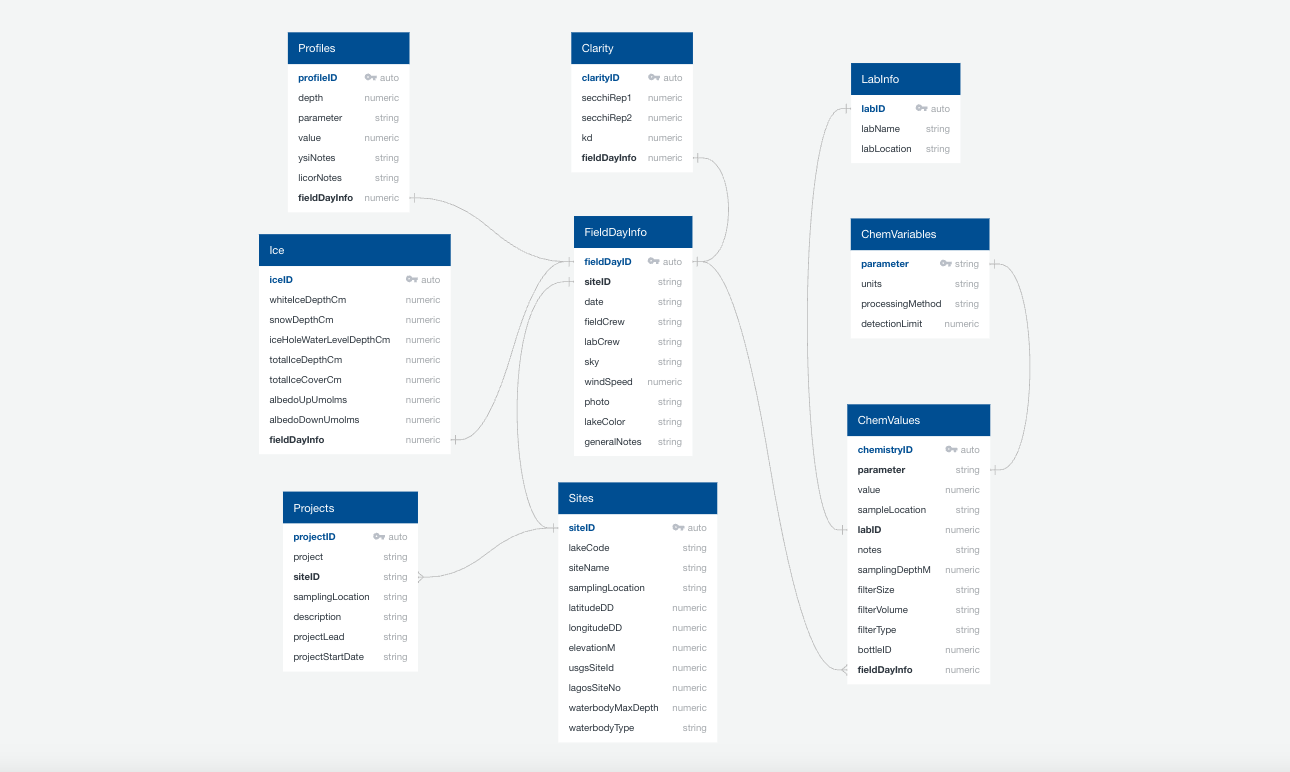
Funded by a USGS grant, I have been designing and implementing a relational database to store lake sampling data collected at The Loch Lake in Rocky Mountain National Park.
Additionally, I've created a series of QA/QC scripts to validate and transform large datasets, algorithms to push new data, and a data dashboard to interact with the db.
Recipe Management
A full-stack application built on a custom API using PostgreSQL and Flask to store and retreive recipe information.
Effeciently stores data and allows the user to update and delete recipes.
Codebase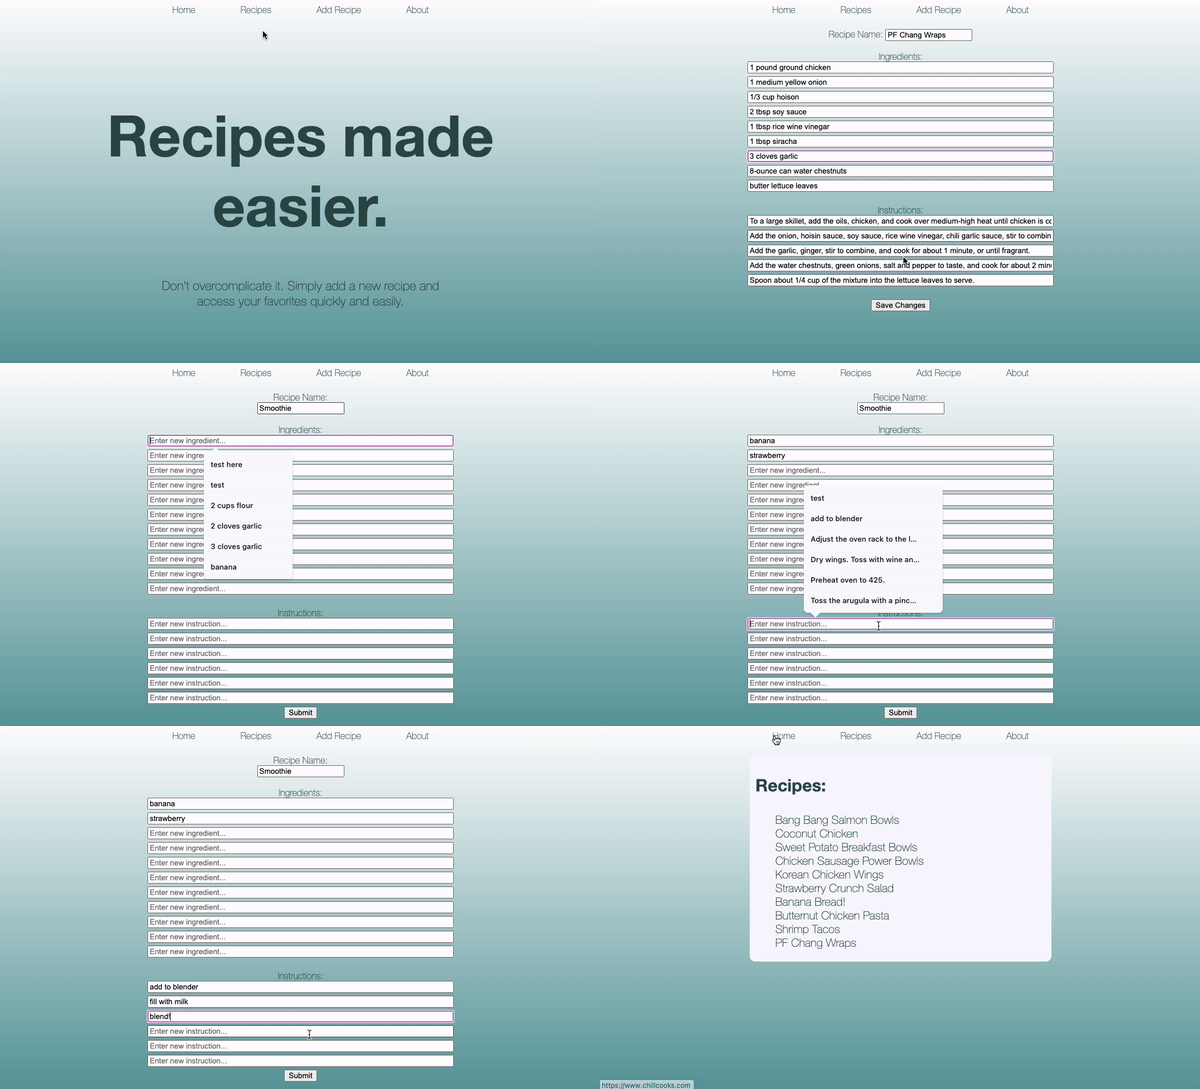
Ski Data Web Scraper
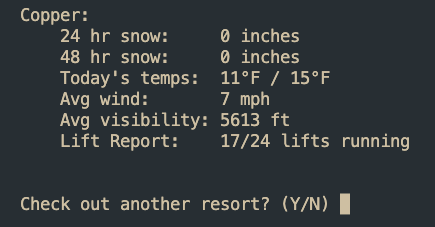
Used web scraping and open-source APIs to collect various ski resort data such as recent snow falls, snowpacks, and lift and trail status reports.
Using a mix of JSONs, SQL, and Cron jobs, the data is updated every hour. Various normalization and "ranking" techniques are applied to the data to tell the user which Ikon ski resort has the best conditions that day.
CodebaseAutomated Emails
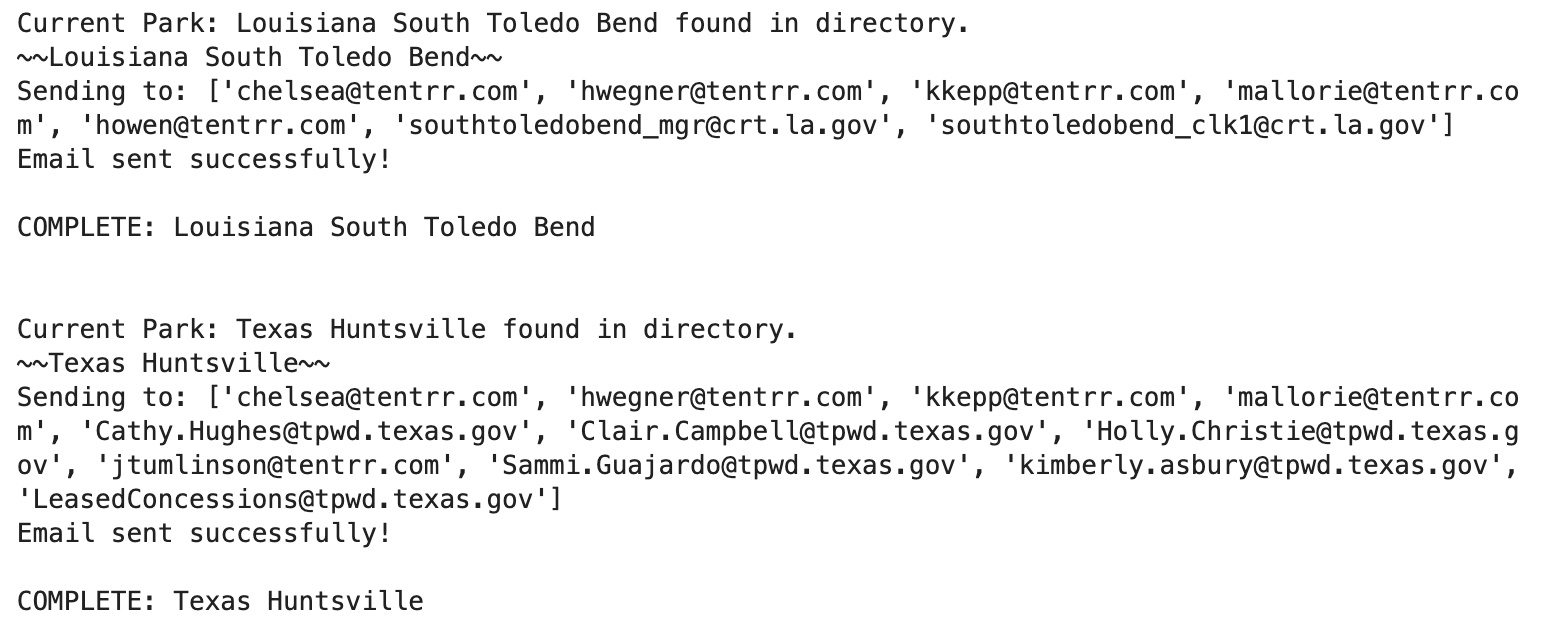
Developed for a short-term reservation company, Tentrr, this project used python, Pandas, and smtplib to create an automated emailing system that reduced task time by 90%. It split a CSV of several hundred reservations into 50 unique PDFs and sent them out 2x/week to over 100 clients.
Track That!
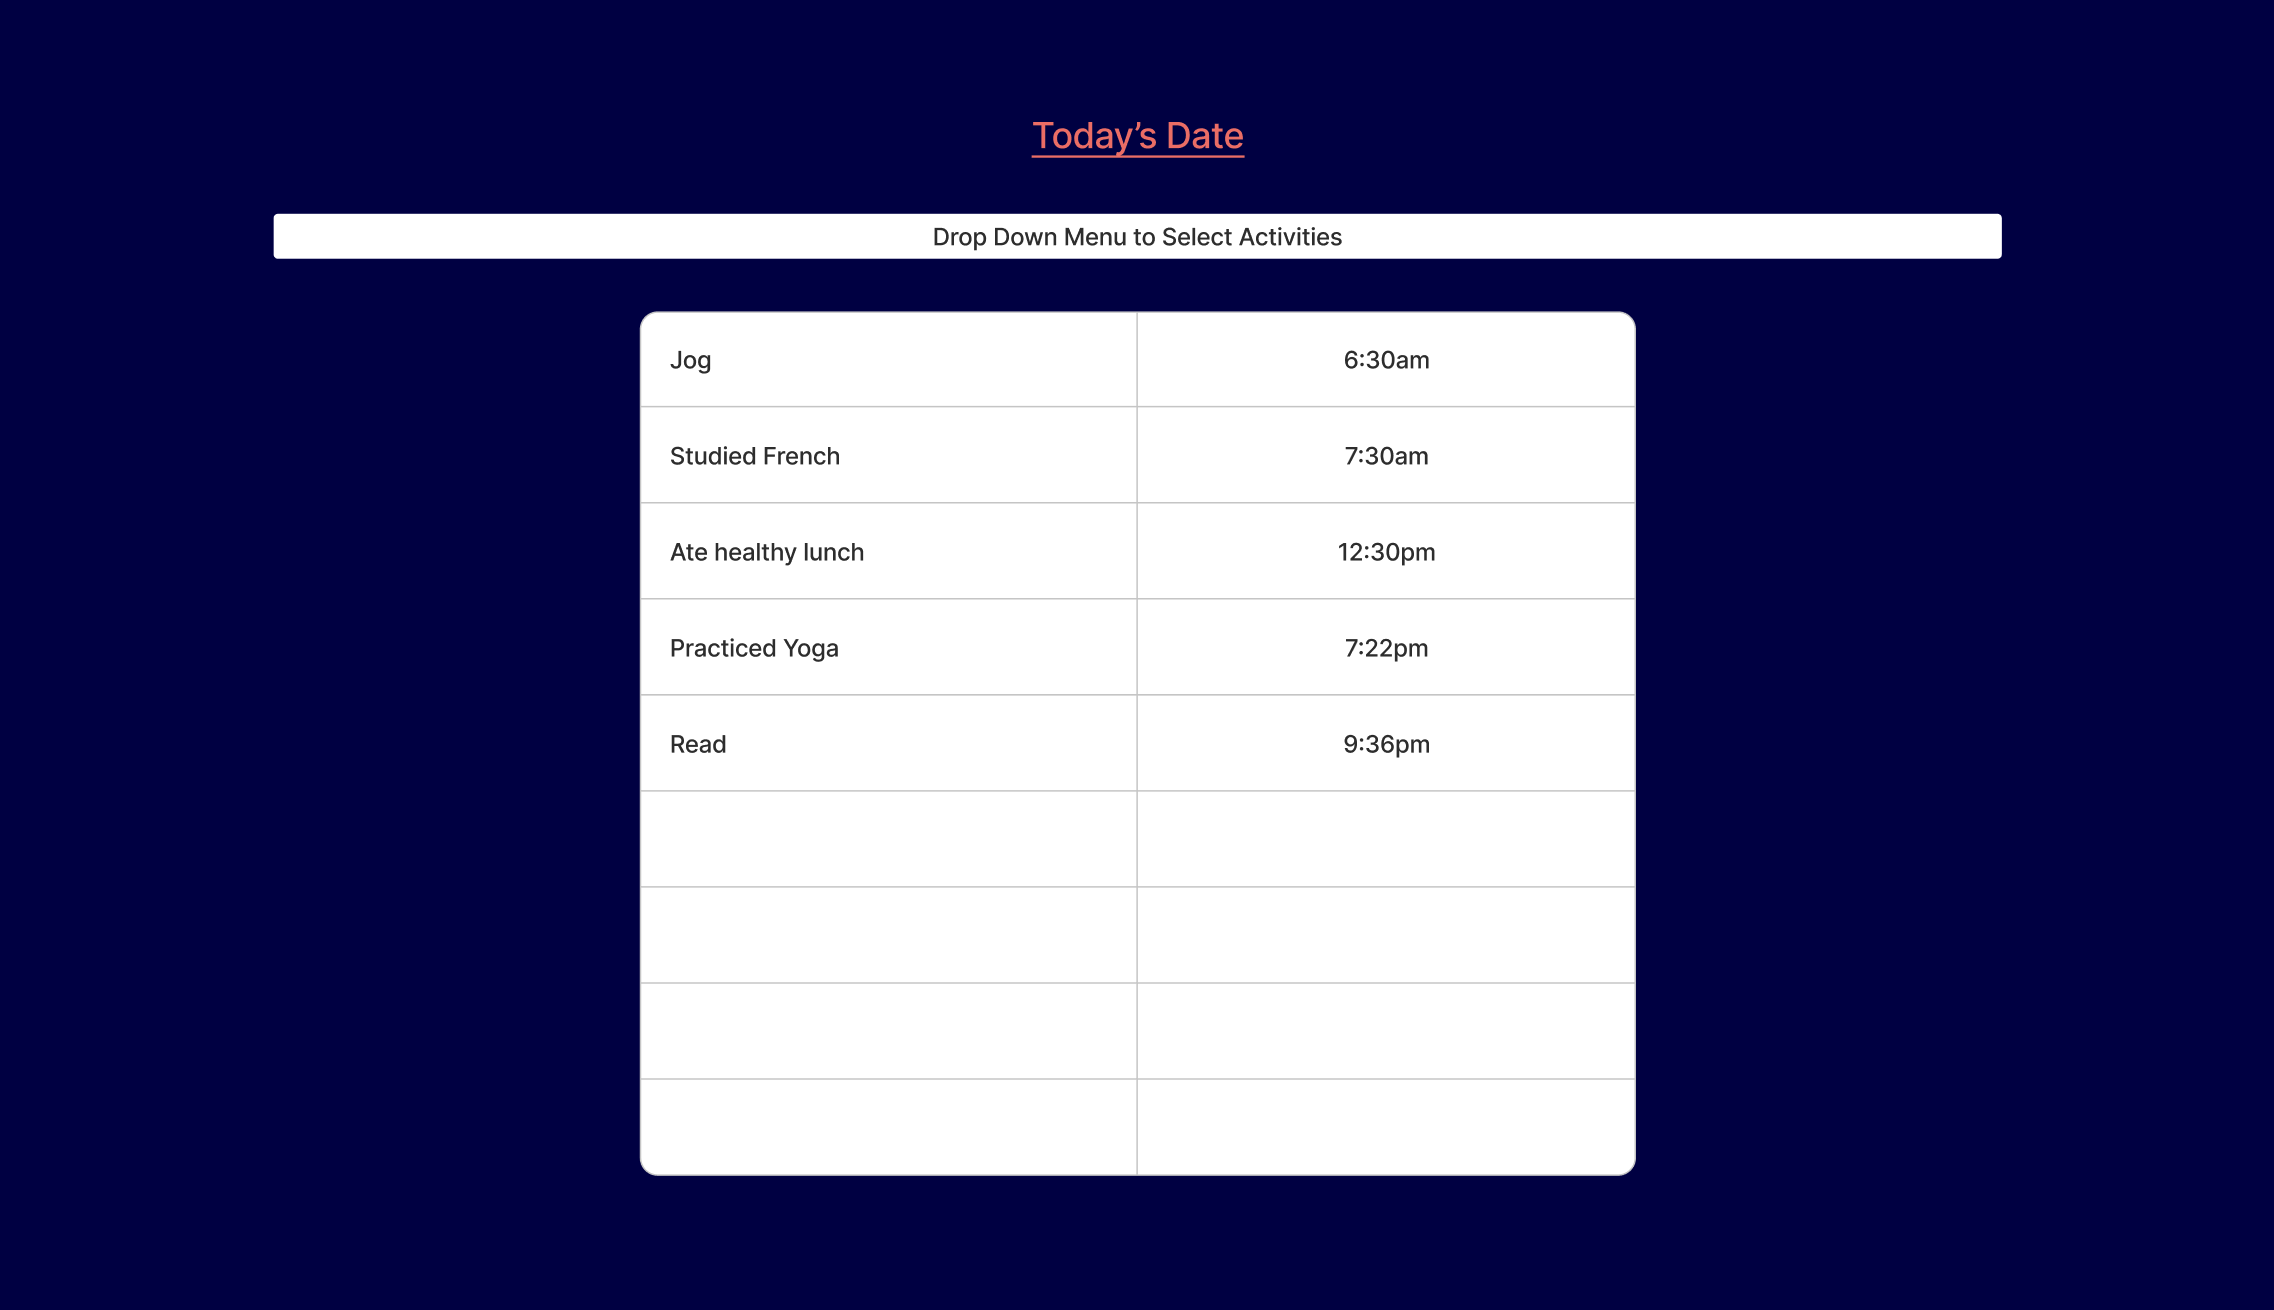
Gained experience with Agile development methods, weekly scrums, working with project managers, and using Git, GitHub and branches as part of a development team.
Utilized SQL and a custom API to add new events and create a database of completed activities with the time and date of completion.
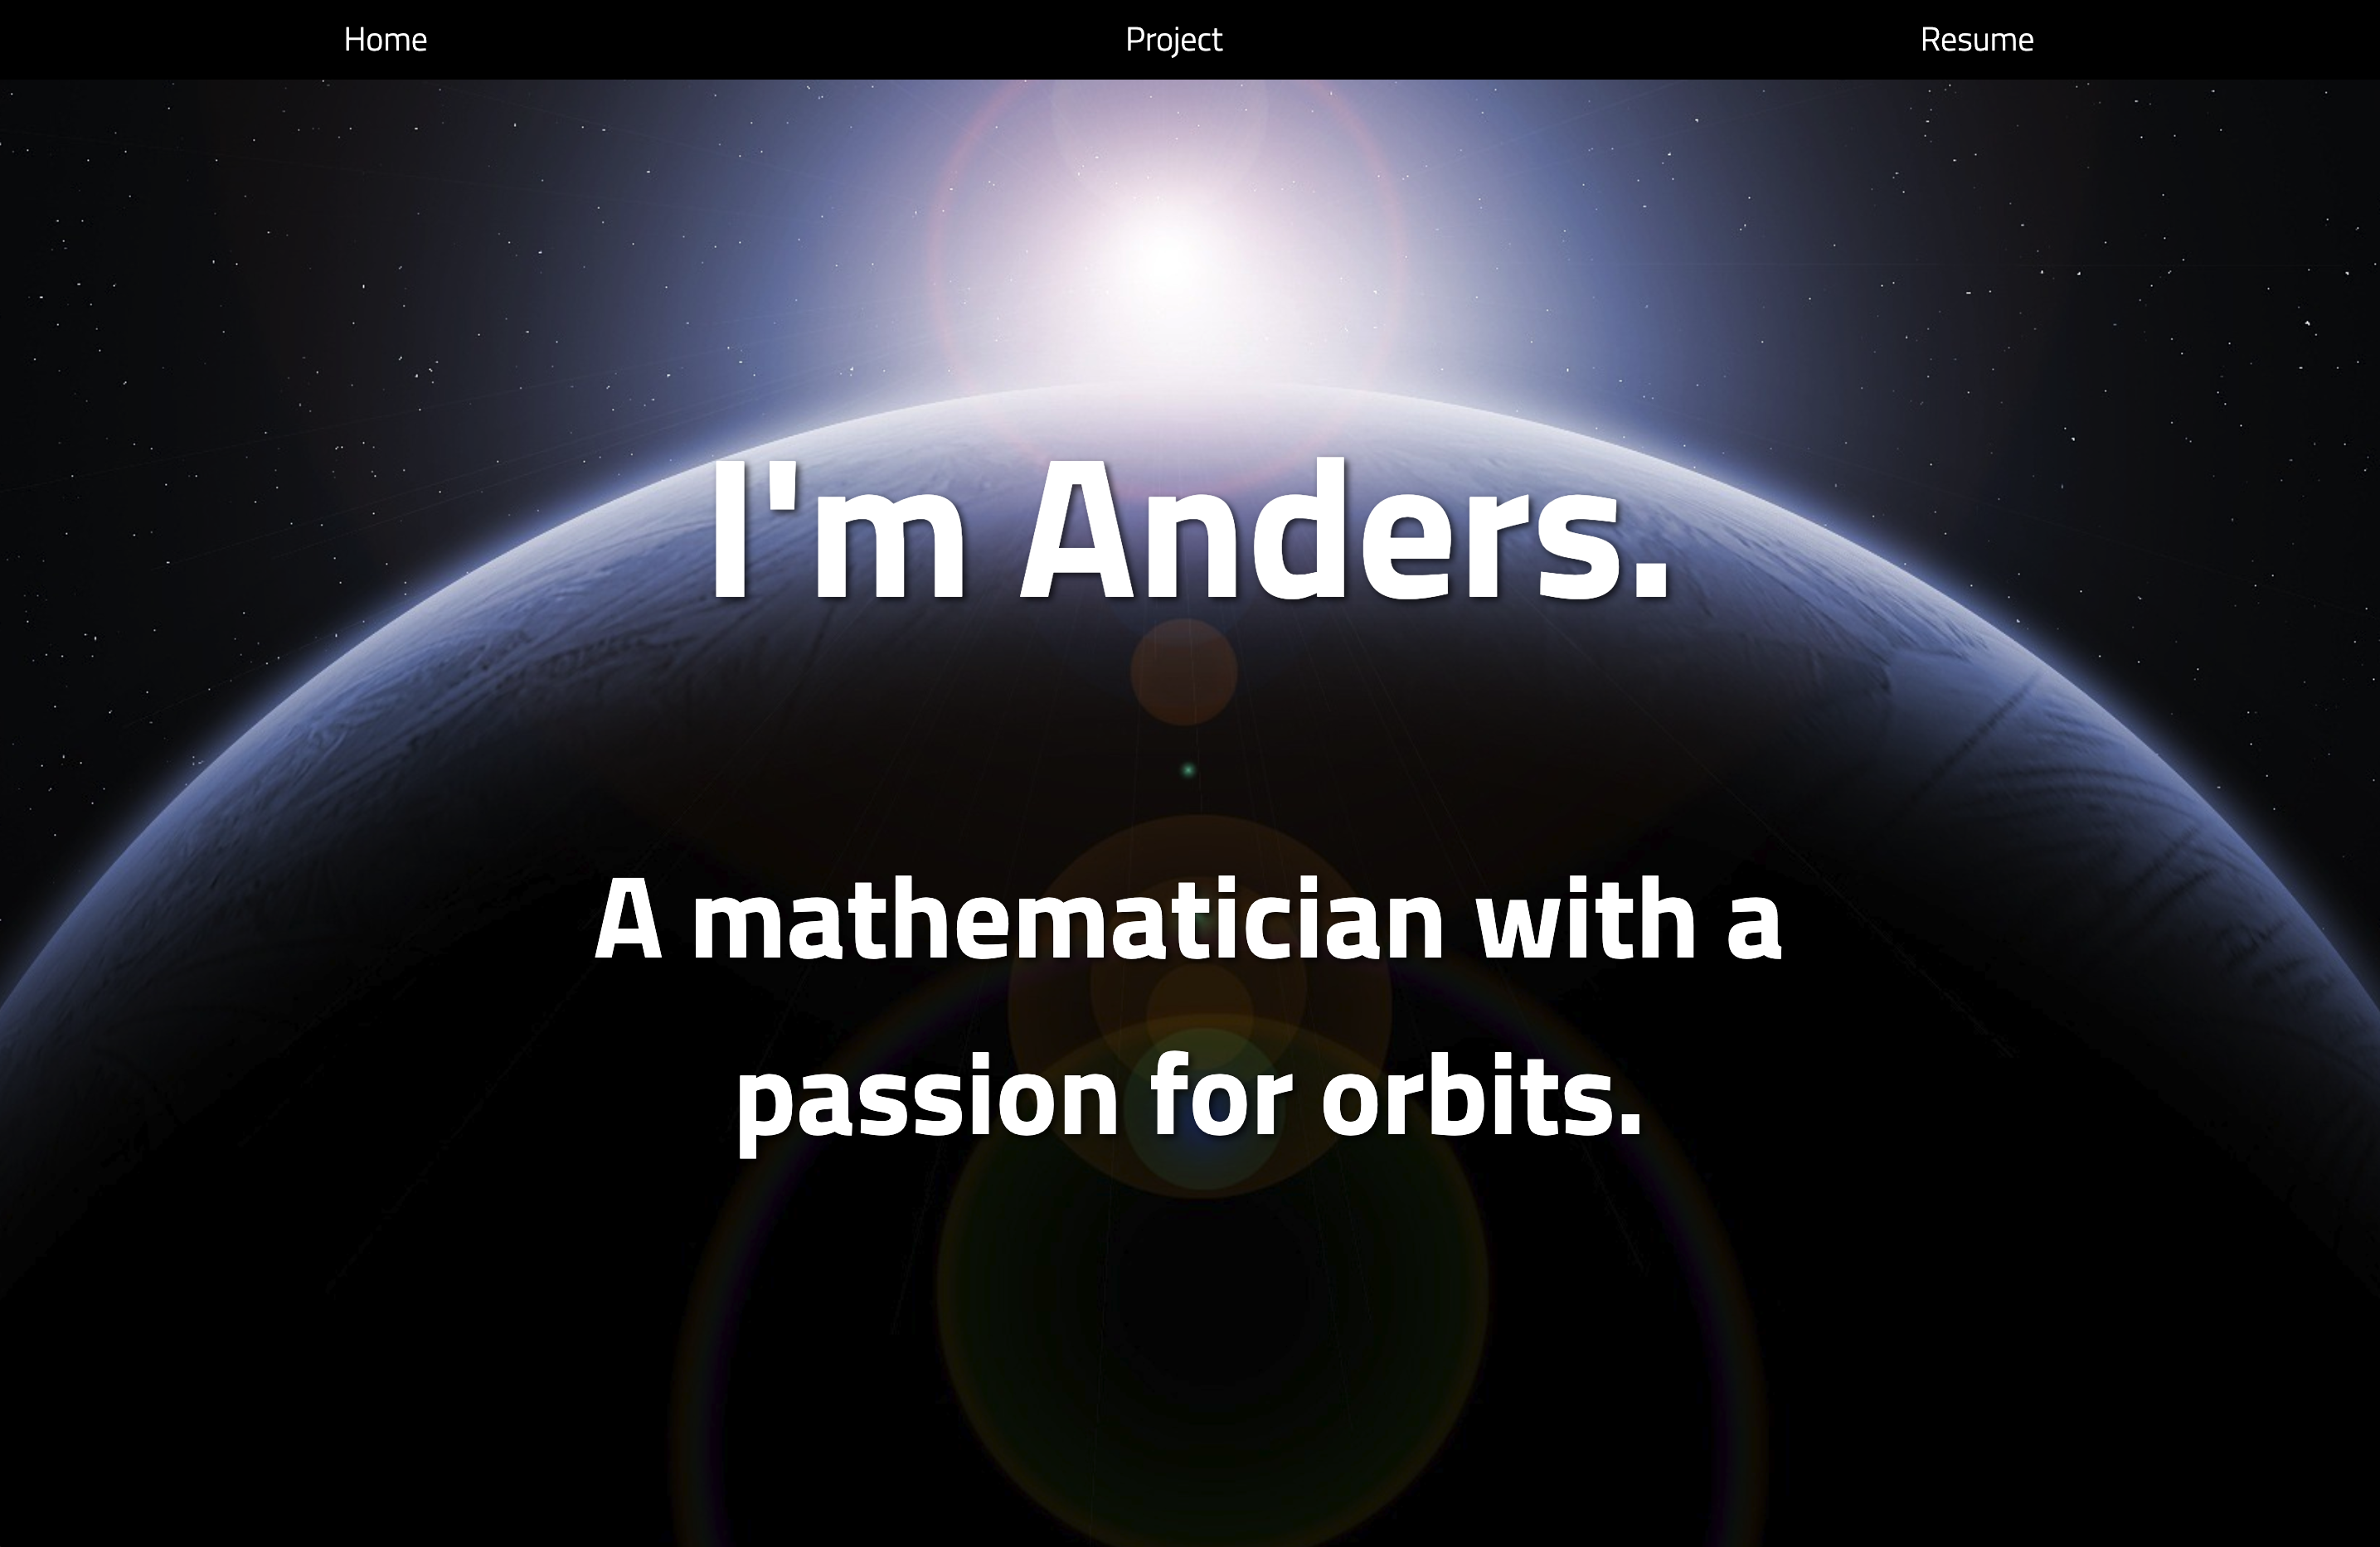
Anders' Orbits
Developed a simple portfolio website for my brother as a Flask application to show off his Senior Capstone Project.
Incorporates embedded latex and a professional design.
Check it out at anders-orbits.com.
Plant Ecophysiology Research
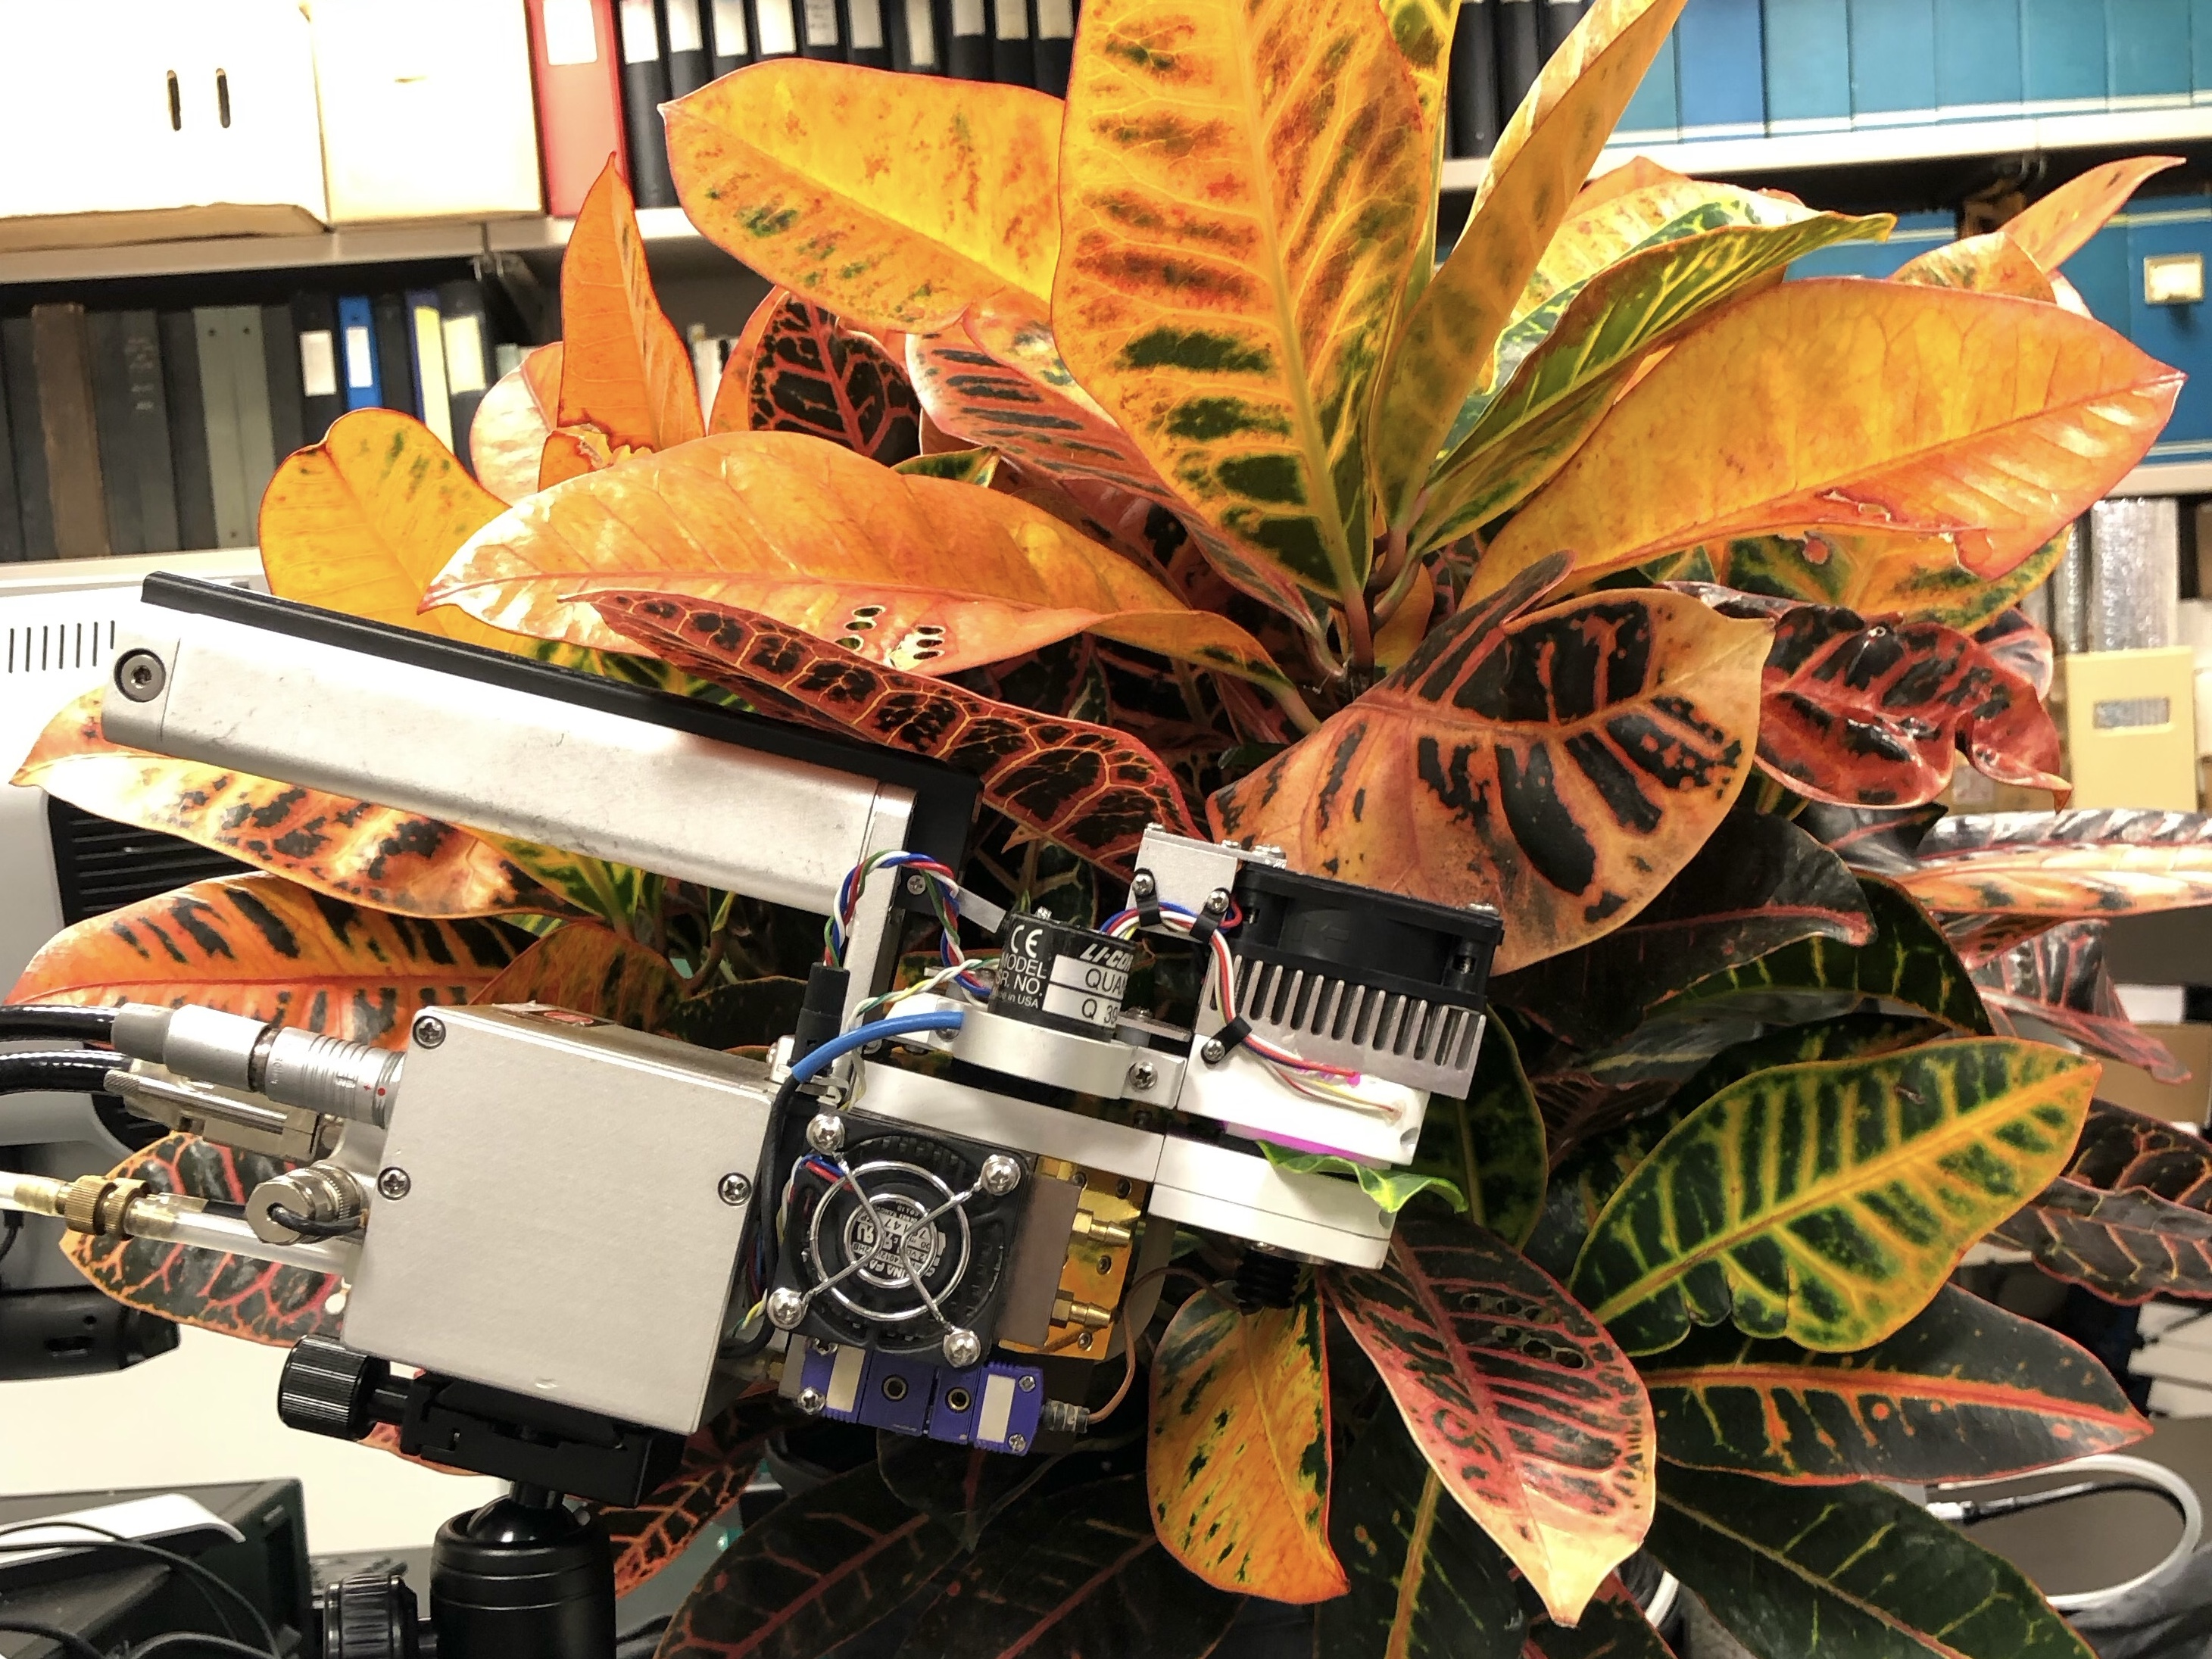
I studied the effects of high light stress on ornamental plants, using croton as a study sample. My research aimed to determine how pigmentation changed with varying light intensity, which relied on the use of a LI-6800 and sampling.
The use of a LI-6800 allowed me to test varying light situations and could see in real time how the plant was reacting.
Most of my projects can be found on my GitHub account page.